Solved

The Graph Below Depicts the Cost Structure for a Firm

Question 437

Multiple Choice

The graph below depicts the cost structure for a firm in a competitive market.
Figure 9-13
The graph below depicts the cost structure for a firm in a competitive market. Figure 9-13   Refer to Figure 9-13. When price rises from P<sub>3</sub> to P<sub>4</sub>, the firm finds that A)  fixed costs are lower at a production level of Q<sub>4</sub>. B)  it can earn a positive profit by increasing production to Q<sub>4</sub>. C)  profit is still maximized at a production level of Q<sub>3</sub>. D)  average revenue exceeds marginal revenue at a production level of Q<sub>4</sub>.
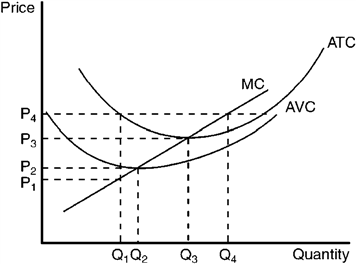
Refer to Figure 9-13. When price rises from P3 to P4, the firm finds that


A) fixed costs are lower at a production level of Q4.
B) it can earn a positive profit by increasing production to Q4.
C) profit is still maximized at a production level of Q3.
D) average revenue exceeds marginal revenue at a production level of Q4.

Correct Answer:

verifed

Verified

Unlock this answer now
Get Access to more Verified Answers free of charge

Related Questions

Unlock this Answer For Free Now!

View this answer and more for free by performing one of the following actions

qr-code

Scan the QR code to install the App and get 2 free unlocks

upload documents

Unlock quizzes for free by uploading documents