Exhibit 10-2 Aggregate supply and demand curves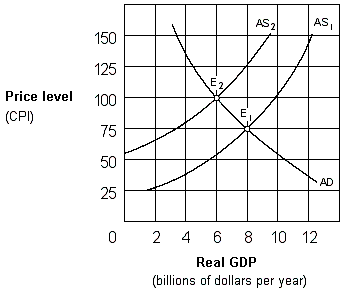
In Exhibit 10-2, the change in equilibrium from E1 to E2 represents:
A) cost-push inflation.
B) demand-pull inflation.
C) price-push inflation.
D) wage-push inflation.
Correct Answer:
Verified
Q84: How are demand-pull and cost-push inflation reflected
Q85: Exhibit 10-4 Aggregate supply and demand curves
Q86: When OPEC caused the price of oil
Q87: Stagflation occurs when the economy experiences:
A) low
Q88: A reduction in regulation will shift the
Q89: Exhibit 10-8 Aggregate demand and supply
Q90: Other factors held constant, a decrease in
Q92: In the United States during the 1960s,
Q93: The aggregate supply curve will shift to
Q94: Exhibit 10-3 Aggregate supply and demand curves
Unlock this Answer For Free Now!
View this answer and more for free by performing one of the following actions

Scan the QR code to install the App and get 2 free unlocks

Unlock quizzes for free by uploading documents