The following graph shows the market equilibrium for corn in the United States. If the world price of corn is $2 and there are no trade restrictions, the United States will: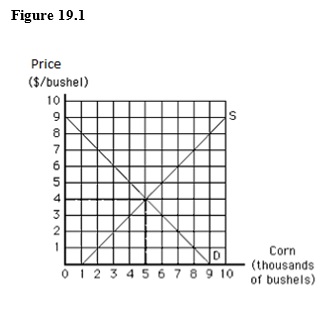
A) produce 3,000 bushels of corn, consume 7,000 bushels of corn, and import 4,000 bushels of corn.
B) produce 3,000 bushels of corn, consume 7,000 bushels of corn, and export 4,000 bushels of corn.
C) have an excess supply of corn.
D) produce 7,000 bushels of corn.
E) produce 5,000 bushels of corn, consume 7,000 bushels of corn, and import 2,000 bushels of corn.
Correct Answer:
Verified
Q43: Unless there are barriers to prevent free
Q45: A lump-sum tax per unit on imports
Q47: Which of the following is not a
Q51: The following table shows the demand, supply,
Q52: The following table shows the demand, supply,
Q53: Tariffs and quotas:
A)reduce consumer surplus and increase
Q54: If there are no trade restrictions,a country
Q57: A charge levied on imports in terms
Q59: The world demand for and the world
Q60: The following graph shows U.S. demand for
Unlock this Answer For Free Now!
View this answer and more for free by performing one of the following actions

Scan the QR code to install the App and get 2 free unlocks

Unlock quizzes for free by uploading documents