The following graph shows U.S. demand for and domestic supply of a good. Suppose the world price of the good is $1.00 per unit and a specific tariff of $0.50 per unit is imposed on each unit of imported good. In such a case, the government revenue from a tariff of $0.50 per unit is represented by the area _____.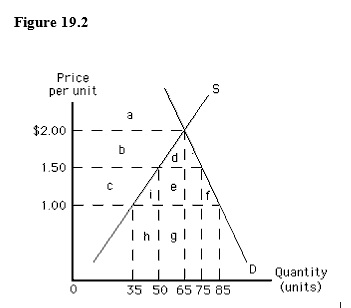
A) c
B) e + g
C) i + e + f
D) d + e
E) e
Correct Answer:
Verified
Q43: Unless there are barriers to prevent free
Q45: A lump-sum tax per unit on imports
Q47: Which of the following is not a
Q55: The following graph shows the market equilibrium
Q59: The world demand for and the world
Q61: The following image shows the market for
Q63: The following graph shows the demand for
Q64: The following graph shows the supply of
Q72: Quotas are favoured over free international trade
Q75: A legal limit on the amount of
Unlock this Answer For Free Now!
View this answer and more for free by performing one of the following actions

Scan the QR code to install the App and get 2 free unlocks

Unlock quizzes for free by uploading documents