The following graph shows the demand for and the supply of a good in a country. If the world price of the good is $2.00 per unit and an import quota of 50 units per month is imposed, then the decrease in consumer surplus can be represented by the area _____.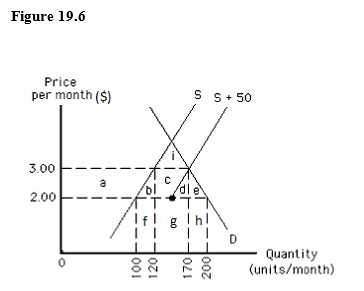
A) f
B) i
C) h
D) f, g, and h
E) a, b, c, d, and e
Correct Answer:
Verified
Q45: A lump-sum tax per unit on imports
Q59: The world demand for and the world
Q60: The following graph shows U.S. demand for
Q61: The following image shows the market for
Q64: The following graph shows the supply of
Q66: The following graph shows the demand for
Q68: The following graph shows the demand for
Q72: Quotas are favoured over free international trade
Q74: Economists argue that U.S.government can earn federal
Q75: A legal limit on the amount of
Unlock this Answer For Free Now!
View this answer and more for free by performing one of the following actions

Scan the QR code to install the App and get 2 free unlocks

Unlock quizzes for free by uploading documents