The following graph shows the demand for and the supply of a good in a country. If the world price of the good is $2.00 per unit, the import quota that would least affect the level of imports in this country is_____.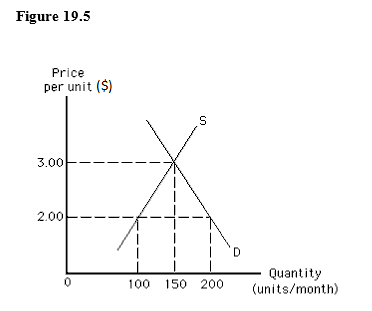
A) $3.00 per unit
B) $2.00 per unit
C) 50 units per month
D) 100 units per month
E) 150 units per month
Correct Answer:
Verified
Q61: An effective import quota:
A)lowers the price of
Q63: The following graph shows the demand for
Q64: The following graph shows the supply of
Q64: Suppose the government of an importing country
Q66: The following graph shows the demand for
Q69: The following graph shows the supply of
Q70: The following graph shows the demand for
Q72: Quotas are favoured over free international trade
Q72: The following image shows the market for
Q74: Economists argue that U.S.government can earn federal
Unlock this Answer For Free Now!
View this answer and more for free by performing one of the following actions

Scan the QR code to install the App and get 2 free unlocks

Unlock quizzes for free by uploading documents