The following graph shows the demand for and domestic supply of a good in a country. If the country decides to trade, then at a world price of $1.00 _____.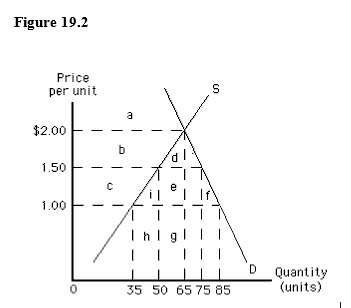
A) 20 units will be exported
B) 20 units will be imported
C) 50 units will be exported
D) 50 units will be imported
E) 10 units will be exported
Correct Answer:
Verified
Q41: The following graph shows U.S. demand for
Q42: The following graph shows the market equilibrium
Q42: Economies of scale in the production of
Q43: The following graph shows U.S. demand for
Q44: The following graph shows U.S. demand for
Q45: The following graph shows U.S. demand for
Q48: When a country imposes a per-unit tariff
Q49: The following table shows the demand, supply,
Q51: The following table shows the demand, supply,
Q54: If there are no trade restrictions,a country
Unlock this Answer For Free Now!
View this answer and more for free by performing one of the following actions

Scan the QR code to install the App and get 2 free unlocks

Unlock quizzes for free by uploading documents