The table given below shows the quantity supplied and the quantity demanded for a good at different prices. If the price of the good described in the table given below is $1.50, then: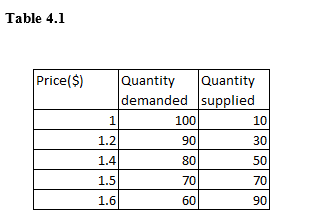
A) there is a shortage in the market.
B) there is a surplus in the market.
C) the market is in equilibrium.
D) the supply of the good increases by 30 units.
E) the demand for the good increases by 30 units.
Correct Answer:
Verified
Q85: Suppose the price of compact disks (CDs)increases,other
Q87: Consider a market for cookies that is
Q91: The market for chewing gum is in
Q92: The table given below shows the quantity
Q92: The most important characteristic of the equilibrium
Q93: Saccharin and aspartame are both low-calorie substitutes
Q93: The table given below shows the quantity
Q94: The table given below shows the quantity
Q102: The following figure shows the market for
Q110: If supply decreases along a given demand
Unlock this Answer For Free Now!
View this answer and more for free by performing one of the following actions

Scan the QR code to install the App and get 2 free unlocks

Unlock quizzes for free by uploading documents