The table given below shows the quantity supplied and the quantity demanded for a good at different prices. If the price of the good described in the table below is $1.60, then an economist would expect the: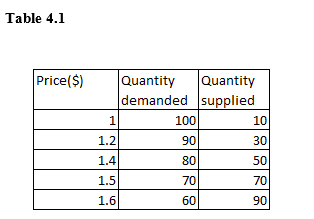
A) price to decrease to $1.40.
B) price to decrease to $1.50.
C) quantity supplied to decrease to 50 units.
D) quantity demanded to increase to 80 units.
E) quantity demanded to decrease to 50 units.
Correct Answer:
Verified
Q81: For a given upward-sloping supply curve,an increase
Q86: Suppose a market is in equilibrium.An increase
Q90: The table given below shows the quantity
Q91: The market for chewing gum is in
Q93: The table given below shows the quantity
Q93: Saccharin and aspartame are both low-calorie substitutes
Q94: The table given below shows the quantity
Q95: Consider a market for kids' shoes that
Q96: For a given upward-sloping supply curve,a decrease
Q97: The table given below shows the quantity
Unlock this Answer For Free Now!
View this answer and more for free by performing one of the following actions

Scan the QR code to install the App and get 2 free unlocks

Unlock quizzes for free by uploading documents