Exhibit 2-6 Production possibilities curve data 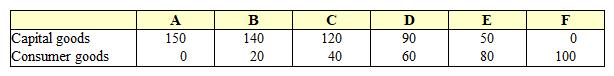 In Exhibit 2-6, the concept of increasing opportunity costs is represented by the fact that:
A) the quantity of capital goods produced must be less than 150.
B) the quantity of consumer goods is constant for each change in the quantity of capital goods produced.
C) greater amounts of capital goods must be sacrificed to produce each additional unit of consumer goods.
D) the amount of consumer goods produced must be greater than zero.
Correct Answer:
Verified
Q105: Exhibit 2-8 Production possibilities curve data 
Q106: Exhibit 2-10 Production possibilities curve data
Q107: Exhibit 2-10 Production possibilities curve data
Q108: Exhibit 2-8 Production possibilities curve data
Q109: Exhibit 2-13 Production possibilities curve Q111: Exhibit 2-7 Production possibilities curve Q112: Exhibit 2-7 Production possibilities curve Q113: Exhibit 2-12 Production possibilities curve Q114: Exhibit 2-10 Production possibilities curve data Q115: Exhibit 2-5 Production possibilities curve Unlock this Answer For Free Now! View this answer and more for free by performing one of the following actions Scan the QR code to install the App and get 2 free unlocks Unlock quizzes for free by uploading documents![]()
![]()
![]()
![]()
![]()

