Exhibit 2-5 Production possibilities curve 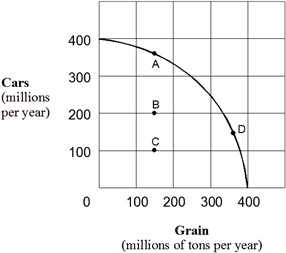 In Exhibit 2-5, movement between which of the following points represents an increase in economic efficiency?
A) A to C.
B) C to D.
C) D to B.
D) A to B.
E) A to D.
Correct Answer:
Verified
Q110: Exhibit 2-6 Production possibilities curve data 
Q111: Exhibit 2-7 Production possibilities curve Q112: Exhibit 2-7 Production possibilities curve Q113: Exhibit 2-12 Production possibilities curve Q114: Exhibit 2-10 Production possibilities curve data Q116: Exhibit 2-11 Production possibilities curves Q117: Exhibit 2-10 Production possibilities curve data Q118: Exhibit 2-10 Production possibilities curve data Q119: Exhibit 2-9 Production possibilities curve Q120: Exhibit 2-9 Production possibilities curve Unlock this Answer For Free Now! View this answer and more for free by performing one of the following actions Scan the QR code to install the App and get 2 free unlocks Unlock quizzes for free by uploading documents![]()
![]()
![]()
![]()
![]()
![]()

