Exhibit 2-9 Production possibilities curve 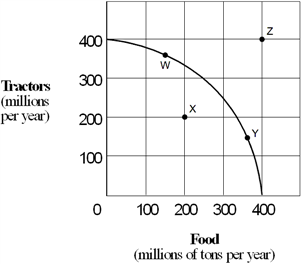 Movement along this production possibilities curve shown in Exhibit 2-9 indicates:
A) that labor is not equally productive or homogeneous (nonhomogeneous) .
B) decreasing opportunity costs.
C) all inputs are homogeneous.
D) all of the above.
Correct Answer:
Verified
Q115: Exhibit 2-5 Production possibilities curve Q116: Exhibit 2-11 Production possibilities curves Q117: Exhibit 2-10 Production possibilities curve data Q118: Exhibit 2-10 Production possibilities curve data Q119: Exhibit 2-9 Production possibilities curve Q121: Exhibit 2-15 Production possibilities curve Q122: Exhibit 2-15 Production possibilities curve Q123: Exhibit 2-16 Production possibilities curve Q124: Exhibit 2-15 Production possibilities curve Q125: Exhibit 2-14 Production possibilities curve Unlock this Answer For Free Now! View this answer and more for free by performing one of the following actions Scan the QR code to install the App and get 2 free unlocks Unlock quizzes for free by uploading documents![]()
![]()

![]()
![]()
![]()
![]()
![]()
![]()

