Exhibit 2-15 Production possibilities curve 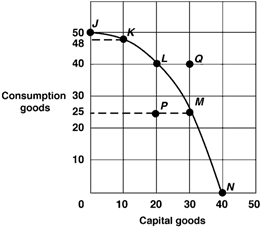 In Exhibit 2-15, if the economy moves from point L to point M, the opportunity cost of producing 10 more capital goods is:
A) 40 less consumer goods.
B) 25 less consumer goods.
C) 15 less consumer goods.
D) 15 more consumer goods.
E) 25 more consumer goods.
Correct Answer:
Verified
Q54: A production possibilities curve shows the various
Q119: Exhibit 2-9 Production possibilities curve Q120: Exhibit 2-9 Production possibilities curve Q121: Exhibit 2-15 Production possibilities curve Q122: Exhibit 2-15 Production possibilities curve Q123: Exhibit 2-16 Production possibilities curve Q125: Exhibit 2-14 Production possibilities curve Q126: Exhibit 2-15 Production possibilities curve Q127: Exhibit 2-16 Production possibilities curve Q129: Exhibit 2-13 Production possibilities curve Unlock this Answer For Free Now! View this answer and more for free by performing one of the following actions Scan the QR code to install the App and get 2 free unlocks Unlock quizzes for free by uploading documents![]()
![]()
![]()
![]()
![]()
![]()
![]()
![]()
![]()

