Exhibit 3-3 Demand curves 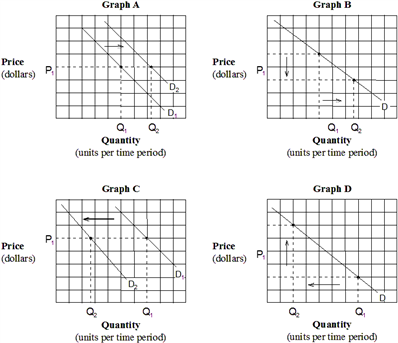 Which of the graphs in Exhibit 3-3 depicts the effect of a decrease in the price of domestic cars on the demand for foreign cars?
A) Graph A.
B) Graph B.
C) Graph C.
D) Graph D.
Correct Answer:
Verified
Q145: Which of the following pairs of goods
Q156: If two goods are complementary, a(n):
A) decrease
Q157: Two goods that are complementary are:
A) wrapping
Q159: If the price of hot dogs increases,
Q172: Exhibit 3-3 Demand curves Q173: Two goods, X and Y, are complementary Q174: There is news that the price of Q175: Exhibit 3-3 Demand curves Q180: Under the law of supply, any decrease Q258: When economists say the quantity supplied of![]()
![]()
Unlock this Answer For Free Now!
View this answer and more for free by performing one of the following actions

Scan the QR code to install the App and get 2 free unlocks

Unlock quizzes for free by uploading documents