Exhibit 3-3 Demand curves 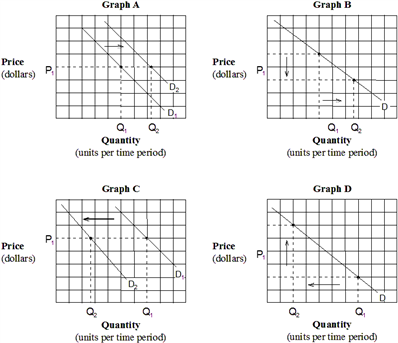 Which of the graphs in Exhibit 3-3 depicts the effect of an increase in income on the demand for DVDs (a normal good) ?
A) Graph A.
B) Graph B.
C) Graph C.
D) Graph D.
Correct Answer:
Verified
Q72: Which of the following states the definition
Q156: If two goods are complementary, a(n):
A) decrease
Q157: Two goods that are complementary are:
A) wrapping
Q159: If the price of hot dogs increases,
Q168: Exhibit 3-3 Demand curves Q169: According to the law of supply a(n): Q173: Two goods, X and Y, are complementary Q175: Exhibit 3-3 Demand curves Q176: Exhibit 3-3 Demand curves Q284: According to the law of supply, Unlock this Answer For Free Now! View this answer and more for free by performing one of the following actions Scan the QR code to install the App and get 2 free unlocks Unlock quizzes for free by uploading documents![]()
A)![]()
![]()
A) more

