Exhibit 3-3 Demand curves 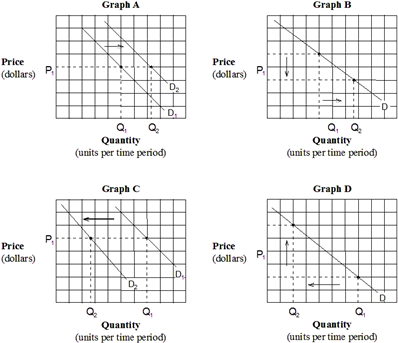 Assume that crackers and soup are complementary goods. Which of the graphs in Exhibit 3-3 depicts the effect of a promotional discount that decreases the price of crackers on the demand for soup?
A) Graph A.
B) Graph B.
C) Graph C.
D) Graph D.
Correct Answer:
Verified
Q72: Which of the following states the definition
Q141: Suppose that X and Y are complementary
Q157: Two goods that are complementary are:
A) wrapping
Q159: If the price of hot dogs increases,
Q164: Exhibit 3-3 Demand curves Q166: Exhibit 3-3 Demand curves Q169: According to the law of supply a(n): Q172: Exhibit 3-3 Demand curves Q180: Assume that peanut butter and jelly are Q284: According to the law of supply, Unlock this Answer For Free Now! View this answer and more for free by performing one of the following actions Scan the QR code to install the App and get 2 free unlocks Unlock quizzes for free by uploading documents![]()
![]()
A)![]()
A) more

