Multiple Choice
Exhibit 3-3 Demand curves 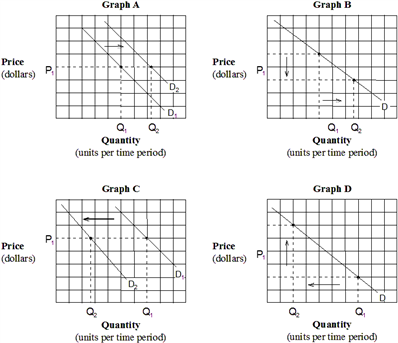 Which of the graphs in Exhibit 3-3 depicts the effect of a decrease in the price of pizza on the demand curve for pizza?
A) Graph A.
B) Graph B
C) Graph C.
D) Graph D.
Correct Answer:
Verified
Related Questions
Q141: Suppose that X and Y are complementary
Q143: If a decrease in price of good
Q150: Assuming DVDs and DVD players are complements,
Q158: Which of the following would most likely
Q166: Exhibit 3-3 Demand curves Q167: Complementary goods are goods:![]()
A) that are consumed
Unlock this Answer For Free Now!
View this answer and more for free by performing one of the following actions

Scan the QR code to install the App and get 2 free unlocks

Unlock quizzes for free by uploading documents