Multiple Choice
Exhibit 3-3 Demand curves 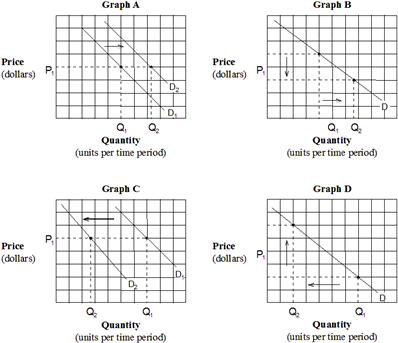 Assume that consumers expect the price of gasoline to rise sharply in the future. Which of the graphs in Exhibit 3-3 depicts this effect?
A) Graph A.
B) Graph B.
C) Graph C.
D) Graph D.
Correct Answer:
Verified
Related Questions
Q72: Which of the following states the definition
Q141: Suppose that X and Y are complementary
Q143: If a decrease in price of good
Q159: If the price of hot dogs increases,
Q164: Exhibit 3-3 Demand curves Q167: Complementary goods are goods:![]()
A) that are consumed
Unlock this Answer For Free Now!
View this answer and more for free by performing one of the following actions

Scan the QR code to install the App and get 2 free unlocks

Unlock quizzes for free by uploading documents