Exhibit 3-10 Demand and supply curves 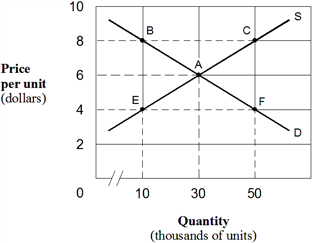 In Exhibit 3-10, which of the following points represents an excess quantity supplied?
A) Point E.
B) Point B.
C) Point C.
D) Point F.
E) Point A.
Correct Answer:
Verified
Q283: Exhibit 3-7 Demand and supply curves 
Q284: Exhibit 3-8 Demand and supply data for radios
Q285: Exhibit 3-8 Demand and supply data for radios
Q286: Exhibit 3-10 Demand and supply curves
Q287: Exhibit 3-8 Demand and supply data for radios
Q289: Exhibit 3-8 Demand and supply data for radios
Q290: Exhibit 3-12 Supply and demand data
Q291: Exhibit 3-9 Demand and supply curves
Q292: Exhibit 3-8 Demand and supply data for radios
Q293: Exhibit 3-6 Milk market ![]()
Unlock this Answer For Free Now!
View this answer and more for free by performing one of the following actions

Scan the QR code to install the App and get 2 free unlocks

Unlock quizzes for free by uploading documents