Exhibit 6-16 Long-run average cost curves 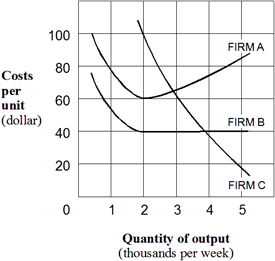 Which firm in Exhibit 6-16 displays a long-run average cost curve with diseconomies beginning at 2,000 units of output per week?
A) Firm A.
B) Firm B.
C) Firm C.
D) Firms A and C.
Correct Answer:
Verified
Q48: A downward-sloping portion of a long-run average
Q116: Long-run economies of scale exist when the
Q187: In the long run, a firm might
Q197: Diseconomies of scale exist over the range
Q201: If a firm's long-run average cost curve
Q203: Exhibit 6-15 Long-run average cost Q204: Exhibit 6-17 Long-run average cost curve Q205: Exhibit 6-15 Long-run average cost Q206: Exhibit 6-16 Long-run average cost curves Q207: Exhibit 6-14 Cost curves Unlock this Answer For Free Now! View this answer and more for free by performing one of the following actions Scan the QR code to install the App and get 2 free unlocks Unlock quizzes for free by uploading documents![]()

![]()
![]()

