Exhibit 20-3 Money market demand and supply curves 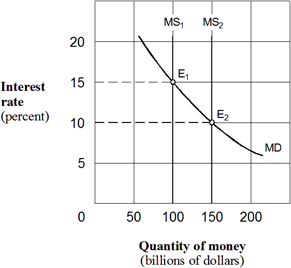 In Exhibit 20-3, assume an equilibrium with an interest rate of 15 percent and the money supply at $100 billion. The Fed uses its policy tools to move the economy to a new equilibrium at E2 with money supply of $150 billion and an interest rate of 10 percent. This change could be the result of a(n) :
A) open market sale of securities by the Fed.
B) higher discount rate set by the Fed.
C) higher required-reserve ratio set by the Fed.
D) open market purchase of securities by the Fed.
Correct Answer:
Verified
Q30: When the Fed reduces the money supply,
Q104: An increase in the money supply
A) lowers
Q110: A decrease in the money supply:
A) raises
Q111: If the Fed reduces the discount rate,
Q112: Suppose that the Fed makes a $100
Q113: Exhibit 20-2 Money market demand and supply curves
Q114: Exhibit 20-3 Money market demand and supply curves
Q116: The impact of an increase in the
Q118: Which of the following is the objective
Q120: Using the aggregate supply and demand model,
Unlock this Answer For Free Now!
View this answer and more for free by performing one of the following actions

Scan the QR code to install the App and get 2 free unlocks

Unlock quizzes for free by uploading documents