Exhibit 2-11 Production possibilities curves 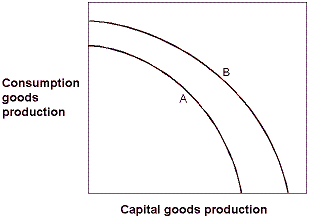
In Exhibit 2-11, which of the following could have caused the production possibilities curve to shift from the one labeled B to the one labeled A?
A) A major natural disaster.
B) An increase in resources.
C) An advance in technology.
D) A decrease in unemployment.
Correct Answer:
Verified
Q69: Exhibit 2-16 Production possibilities curve 
Q70: Exhibit 2-10 Production possibilities curve data
Q72: Exhibit 2-13 Production possibilities curve
Q73: Draw a graph of a production possibilities
Q74: Exhibit 2-6 Production possibilities curve data
Q75: Exhibit 2-15 Production possibilities curve
Q76: Exhibit 2-9 Production possibilities curve
Q77: Exhibit 2-14 Production possibilities curve
Q78: Exhibit 2-13 Production possibilities curve
Q80: When the opportunity cost of producing carrots
Unlock this Answer For Free Now!
View this answer and more for free by performing one of the following actions

Scan the QR code to install the App and get 2 free unlocks

Unlock quizzes for free by uploading documents