Exhibit 2-14 Production possibilities curve 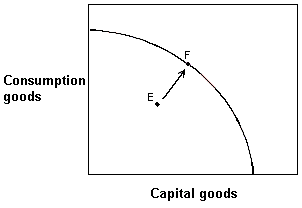
In Exhibit 2-14, which of the following explains this economy's movement from point E to point F?
A) The rate of unemployment in this economy would have increased.
B) Consumption goods production has increased, but capital goods production has decreased.
C) The economy has decreased unemployment, but some degree of unemployment still exists
D) The economy has achieved full employment.
Correct Answer:
Verified
Q64: The production possibility curve is bowed outward
Q71: The law of increasing costs indicates that
Q72: Exhibit 2-13 Production possibilities curve 
Q73: Exhibit 2-11 Production possibilities curves
Q74: Exhibit 2-6 Production possibilities curve data
Q75: Exhibit 2-15 Production possibilities curve
Q76: Exhibit 2-9 Production possibilities curve
Q78: Exhibit 2-13 Production possibilities curve
Q81: Exhibit 2-18 Production possibilities curves
Q81: An analysis of production possibilities curves indicates
Unlock this Answer For Free Now!
View this answer and more for free by performing one of the following actions

Scan the QR code to install the App and get 2 free unlocks

Unlock quizzes for free by uploading documents