Exhibit 2-18 Production possibilities curves 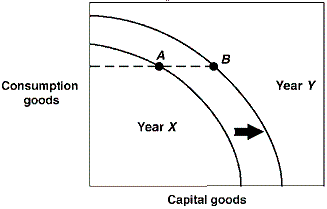
In Exhibit 2-18, a country is located at point A on its Year X production possibilities curve. In Year Y this same country is located at point B on its Year Y production possibilities curve. Which of the following could have brought about this outward shift in production possibilities curves?
A) More efficient production in Year X than in Year Y.
B) A natural disaster in Year X which leads to a destruction of resources.
C) Higher unemployment in Year X.
D) An advance in technology occurred in Year X.
Correct Answer:
Verified
Q64: The production possibility curve is bowed outward
Q71: The law of increasing costs indicates that
Q76: Exhibit 2-9 Production possibilities curve 
Q77: Exhibit 2-14 Production possibilities curve
Q78: Exhibit 2-13 Production possibilities curve
Q81: An analysis of production possibilities curves indicates
Q83: Exhibit 2-18 Production possibilities curves
Q85: Exhibit 2-18 Production possibilities curves
Q86: Exhibit 2-17 Production possibilities curve
Q96: The production possibilities curve for the nation
Unlock this Answer For Free Now!
View this answer and more for free by performing one of the following actions

Scan the QR code to install the App and get 2 free unlocks

Unlock quizzes for free by uploading documents