Exhibit 2-18 Production possibilities curves 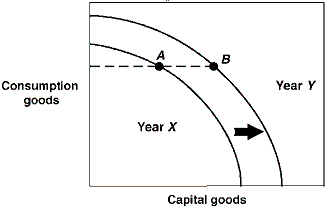
In Exhibit 2-18, the production possibilities curves for a country are shown for the years Year X and Year Y. Suppose this country was located at point A in Year X and point B in Year Y. This country:
A) is producing the same number of capital goods in both years.
B) is producing the same number of consumption goods in both years.
C) has shown no growth between Year X and Year Y.
D) has higher unemployment in Year X than in Year Y.
Correct Answer:
Verified
Q64: The production possibility curve is bowed outward
Q81: An analysis of production possibilities curves indicates
Q81: Exhibit 2-18 Production possibilities curves 
Q82: Economic growth may be represented by a(n):
A)
Q83: Exhibit 2-18 Production possibilities curves
Q86: Exhibit 2-17 Production possibilities curve
Q96: The production possibilities curve for the nation
Q97: Which of the following causes the production
Q100: On a production possibilities curve diagram, greater
Q145: With time, which one of the following
Unlock this Answer For Free Now!
View this answer and more for free by performing one of the following actions

Scan the QR code to install the App and get 2 free unlocks

Unlock quizzes for free by uploading documents