Exhibit 2-18 Production possibilities curves 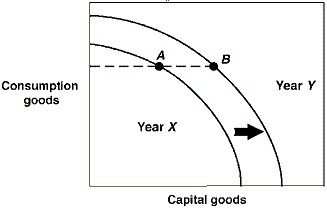
In Exhibit 2-18, the production possibilities curves for a country are shown for the years Year X and Year Y. Suppose this country was located at point A in Year X and point B in Year Y. This economy:
A) is worse off in Year Y than in Year X.
B) has stagnated production in this two year period.
C) has less unemployment in Year Y than it did in Year X.
D) has shown growth between these two years.
Correct Answer:
Verified
Q64: The production possibility curve is bowed outward
Q71: The law of increasing costs indicates that
Q78: Exhibit 2-13 Production possibilities curve 
Q81: An analysis of production possibilities curves indicates
Q81: Exhibit 2-18 Production possibilities curves
Q82: Economic growth may be represented by a(n):
A)
Q85: Exhibit 2-18 Production possibilities curves
Q86: Exhibit 2-17 Production possibilities curve
Q96: The production possibilities curve for the nation
Q97: Which of the following causes the production
Unlock this Answer For Free Now!
View this answer and more for free by performing one of the following actions

Scan the QR code to install the App and get 2 free unlocks

Unlock quizzes for free by uploading documents