The graph shown depicts which of the following? 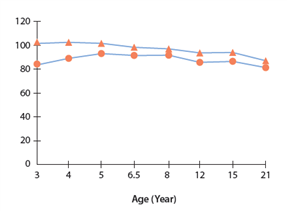
A) reading scores and math scores of Head Start children
B) achievement scores of boys (top) and girls (bottom) in Head Start
C) IQ scores of children in the Abecedarian group (upper line) and in Head Start (lower line)
D) IQ scores of children in the Abecedarian group and in a control group
Correct Answer:
Verified
Q24: A probable reason why the Abecedarian Project
Q25: When scientists say that siblings share 50%
Q26: Why do Japanese schools prefer large classes?
A)
Q27: Which of the following refers to observable
Q28: Joe's parents were professional athletes, so he
Q30: Regarding starting school, an environmentalist is likely
Q31: Which of the following is true of
Q32: Which of the following is most clearly
Q33: Consider the story of Olly Neal, who
Q34: In their studies of heritability, whom do
Unlock this Answer For Free Now!
View this answer and more for free by performing one of the following actions

Scan the QR code to install the App and get 2 free unlocks

Unlock quizzes for free by uploading documents