Use the figure below to answer the following question(s) . Figure 4-7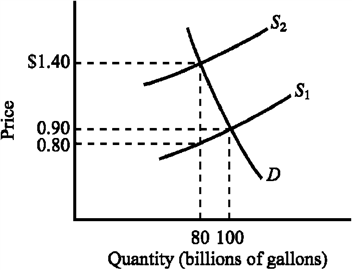 Refer to Figure 4-7. The supply curve S1 and the demand curve D indicate initial conditions in the market for gasoline. A $.60-per-gallon excise tax on gasoline is levied, which shifts the supply curve from S1 to S2. Imposing the tax causes the equilibrium price of gasoline to increase from
A) $.80 to $1.40.
B) $.80 to $1.50.
C) $.90 to $1.50.
D) $.90 to $1.40.
Correct Answer:
Verified
Q190: Use the figure below to answer the
Q191: Use the figure below to answer the
Q192: Use the figure below to answer the
Q193: Use the figure below to answer the
Q194: Use the figure below to answer the
Q196: Use the figure below to answer the
Q197: Use the figure below illustrating the impact
Q198: Use the figure below to answer the
Q199: Use the figure below to answer the
Q200: Use the figure below to answer the
Unlock this Answer For Free Now!
View this answer and more for free by performing one of the following actions

Scan the QR code to install the App and get 2 free unlocks

Unlock quizzes for free by uploading documents