Use the figure below to answer the following question(s) . Figure 4-7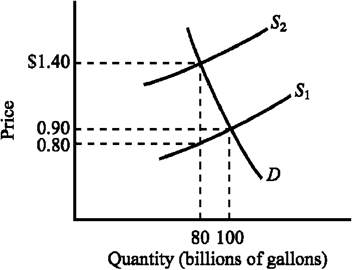 Refer to Figure 4-7. The supply curve S1 and the demand curve D indicate initial conditions in the market for gasoline. A $.60-per-gallon excise tax on gasoline is levied. How much revenue does the $.60-per-gallon tax generate for the government?
A) $40 billion
B) $48 billion
C) $50 billion
D) $60 billion
Correct Answer:
Verified
Q194: Use the figure below to answer the
Q195: Use the figure below to answer the
Q196: Use the figure below to answer the
Q197: Use the figure below illustrating the impact
Q198: Use the figure below to answer the
Q200: Use the figure below to answer the
Q201: Figure 4-18 Q202: Use the figure below to answer the Q203: Figure 4-18 Q204: Figure 4-15 Unlock this Answer For Free Now! View this answer and more for free by performing one of the following actions Scan the QR code to install the App and get 2 free unlocks Unlock quizzes for free by uploading documents![]()
![]()
![]()

