Exhibit 13-13 Graphical analysis can be used to determine the rate law for a general reaction of reactant "A" going to products "B" and "C".
A→B + C
Refer to Exhibit 13-13. Which of the Time-Concentration plots shown below confirms that a particular reaction follows a zero order rate law ?
A) 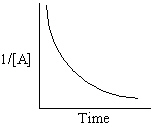
B) 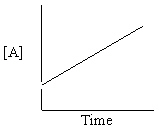
C) 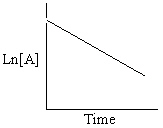
D) 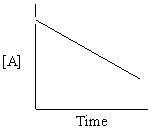
E) 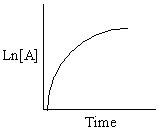
Correct Answer:
Verified
Q88: The y-intercept on a second order Time-Concentration
Q89: The reaction X + Y→Z has the
Q90: The gas phase reaction X + Z
Q91: The reaction A + B→C obeys the
Q92: A sample of the radioactive isotope 90Sr
Q94: The highly toxic pesticide parathion, (C2H5O)2PSOC6H4NO2, decomposes
Q95: For the zero order rate law
Q96: Exhibit 13-13 Graphical analysis can be used
Q97: Which rate law given below corresponds to
Q98: The gas phase reaction C2H4 + Cl2→C2H4Cl2
Unlock this Answer For Free Now!
View this answer and more for free by performing one of the following actions

Scan the QR code to install the App and get 2 free unlocks

Unlock quizzes for free by uploading documents