Multiple Choice
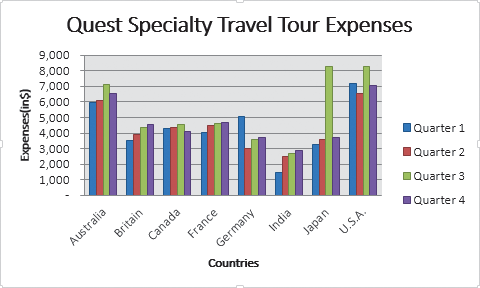 In the accompanying figure, what chart item explains which color represents each quarter?
A) value area
B) plot area
C) series area
D) legend
Correct Answer:
Verified
Related Questions
Q23: On a chart created in Excel, the
Q26: Sub gridlines show the values between the
Q194: In a pie chart, you can emphasize
Q197: The x-axis and y-axis are, respectively, the

