Multiple Choice
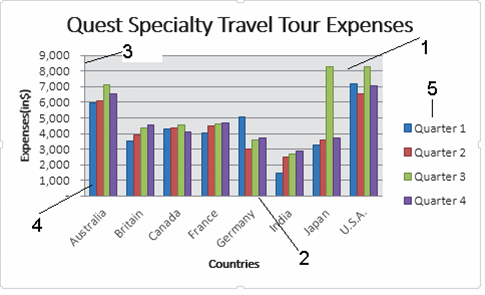 In the accompanying figure, item 5 represents ____.
A) data markers
B) tick marks
C) the plot area
D) the legend
Correct Answer:
Verified
Related Questions
Q23: On a chart created in Excel, the
Q37: On a chart created in Excel, the
Q194: In a pie chart, you can emphasize
Q197: The x-axis and y-axis are, respectively, the

