Use the following graph for problems 8 through 10. This graph represents the number of hours by month spent by company XYZ on special projects. 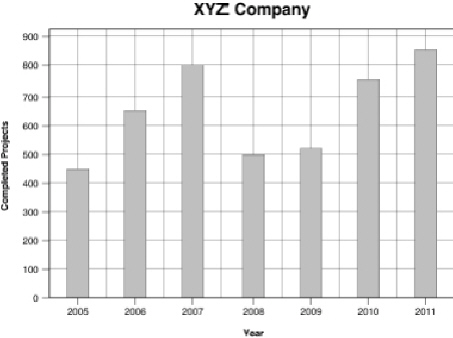 In the graph above, which year had the least completed projects?
Correct Answer:
Verified
Q1: In the graph above, if the total
Q2: Use the following graph for problems 3
Q3: In the graph above, what percent represents
Q4: Circle graphs are used to display the
Q5: In the graph above, which type of
Q6: In the graph above, which type of
Q7: In the graph above, how many projects
Q8: Bar graphs and line graphs are most
Q9: In the graph above, between which two
Unlock this Answer For Free Now!
View this answer and more for free by performing one of the following actions

Scan the QR code to install the App and get 2 free unlocks

Unlock quizzes for free by uploading documents