Multiple Choice
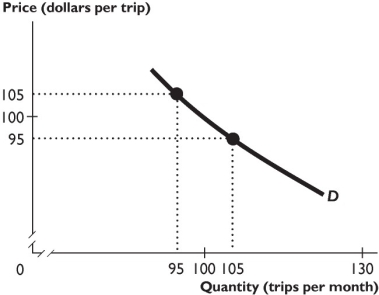
-The demand curve shown in the figure above is ________ over the price range from $95 to $105 per trip.
A) perfectly elastic
B) perfectly inelastic
C) unit elastic
D) elastic but not perfectly elastic
E) inelastic but not perfectly inelastic
Correct Answer:
Verified
Related Questions

