Consider the following score diagram. 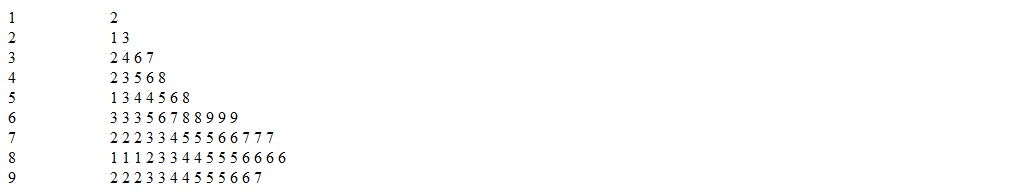 This score diagram is called a _________.
A) histogram
B) frequency polygon
C) box plot
D) stem and leaf diagram
Correct Answer:
Verified
Q38: A distribution which has a predominance of
Q39: In a frequency polygon the points are
Q40: When individual scores are combined into groups,
Q41: All frequency distributions should be of grouped
Q42: In grouping scores, the wider the intervals,
Q44: In constructing a frequency distribution of grouped
Q45: If a curve is negatively skewed, most
Q46: A bell shaped curve is an example
Q47: Consider the following stem-and-leaf diagram. 
Q48: The percentile point for a distribution of
Unlock this Answer For Free Now!
View this answer and more for free by performing one of the following actions

Scan the QR code to install the App and get 2 free unlocks

Unlock quizzes for free by uploading documents