Passage
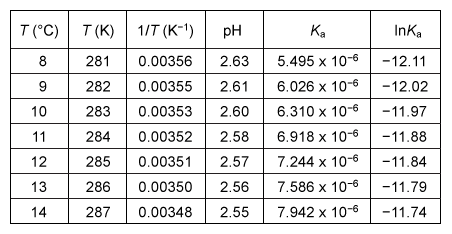
Students conducted an experiment to determine the changes in enthalpy ΔH°, entropy ΔS°, and Gibbs free energy ΔG° resulting from the dissociation of acetic acid (CH3COOH) in water. The students first determined the acid dissociation constant Ka for the reaction by measuring the pH of a 1 M acetic acid solution at various temperatures over a narrow range of less than 10 °C.To perform the pH measurements, the acetic acid solution was initially cooled to 0 °C using an ice bath and then warmed with gentle heating to room temperature with continuous stirring. The pH was recorded at intervals of 1 °C. From the pH data, the value of Ka at each temperature T was calculated. The experimental results over the selected temperature range are shown in Table 1.Table 1 Student Data for the pH and Ka of Acetic Acid with Increasing Temperature
 To evaluate ΔH° and ΔS°, the students constructed a van 't Hoff plot (Figure 1) , which is a graph of the natural log of the dissociation constant (ln Ka) vs. the reciprocal absolute temperature (1/T) .
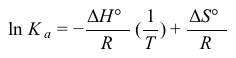
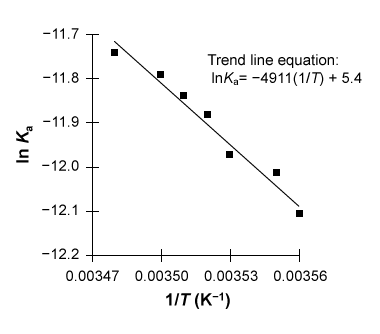 Figure 1 Linear van 't Hoff plot relating the dissociation constant Ka of acetic acid to temperature TThe relationship between Ka, T, ΔH°, and ΔS° in the van 't Hoff plot was then described using a linear fit of the data following the form of Equation 1, in which R is the gas constant (8.3 J∙mol−1∙K−1) .
 Adapted from: C. Rezsnyak "Determination of Thermodynamic Values (S°, H°, and G°) from the Dissociation of a Weak Acid" World Journal of Chemical Education. ©2017 Science and Education Publishing.
-According to the experimental results in the passage, the dissociation of acetic acid is:spontaneous at all temperatures.nonspontaneous at low temperatures.spontaneous at high temperatures.
A) I only
B) II only
C) III only
D) II and III only
Correct Answer:
Verified
Q261: Passage
Sulfur is the 10th most abundant element
Q262: Passage
Sulfur is the 10th most abundant element
Q263: Assume that helium behaves as an ideal
Q264: Atoms of a given element have a
Q265: The emission line spectra of hydrogen, lithium,
Q267: Passage
Sulfur is the 10th most abundant element
Q268: The effective nuclear charge experienced by the
Q269: Litmus paper will turn blue when immersed
Q270: Passage
Students conducted an experiment to determine the
Q271: Which of the following molecular structures has
Unlock this Answer For Free Now!
View this answer and more for free by performing one of the following actions

Scan the QR code to install the App and get 2 free unlocks

Unlock quizzes for free by uploading documents