The figure below shows the titration curve for an acid titrated with aqueous sodium hydroxide. 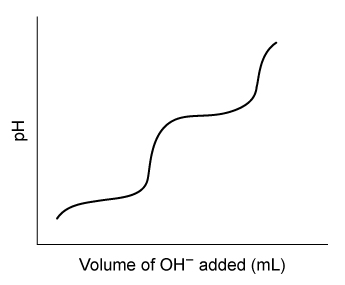 When titrated in solution, which of the following salts would be most likely to produce a similar titration curve?
A) H3PO4
B) KH2PO4
C) Na2HPO4
D) K3PO4
Correct Answer:
Verified
Q286: Which chemical properties below are those of
Q287: Passage
Oxytocin is a naturally occurring peptide hormone
Q288: Passage
Oxytocin is a naturally occurring peptide hormone
Q289: Phosphorus-32 is a radioactive beta-emitter used in
Q290: The bond enthalpies for six selected chemical
Q292: Atoms of solid polonium are packed in
Q293: Which of the following equations correctly represents
Q294: Passage
Oxytocin is a naturally occurring peptide hormone
Q295: During beta decay, a radioactive atomic nucleus
Q296: Passage
Oxytocin is a naturally occurring peptide hormone
Unlock this Answer For Free Now!
View this answer and more for free by performing one of the following actions

Scan the QR code to install the App and get 2 free unlocks

Unlock quizzes for free by uploading documents