Which of the following graphs best illustrates how the intensity of sound varies as a detector is moved further and further from a stationary source projecting sound in all directions? (Note: Ignore the Doppler effect)
A) 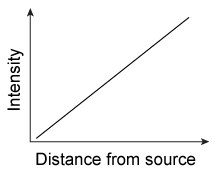
B) 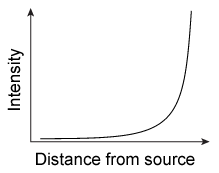
C) 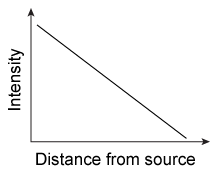
D) 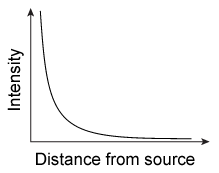
Correct Answer:
Verified
Q120: Passage
Nitrogen is extremely cold in its liquid
Q121: Two convex lenses are placed in series
Q122: Atmospheric pressure on a distant planet causes
Q123: Relative to the angle of incidence, how
Q124: A sample of water vapor undergoes deposition
Q126: Which of the following color transitions best
Q127: Which unit ratio CANNOT be used to
Q128: A scientist studying capillary fluid exchange in
Q129: A dielectric material is introduced into the
Q130: In the presence of an external magnetic
Unlock this Answer For Free Now!
View this answer and more for free by performing one of the following actions

Scan the QR code to install the App and get 2 free unlocks

Unlock quizzes for free by uploading documents