The graph below depicts the yearly incidence of viral hepatitis per 100,000 people in the United States from 1982 to 2012. (US) . 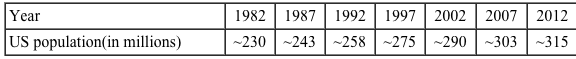 The overall population of the United States increased throughout this time period, as seen in the table below: 11ec160b 371f 9291 9249 659e3ae21c65 MD0001 00 The number of people at risk of hepatitis infection is considered to be equal to the whole US population at any given moment. Which of the following is more likely based on this information?
A) After 2006, hepatitis B prevalence surpassed hepatitis A and hepatitis C prevalence
B) In 1987, there were as many individuals with hepatitis A as with hepatitis B in the US
C) In 1989, there were more individuals with hepatitis A than with hepatitis B in the US
D) In 1997, there were more new cases of hepatitis A than of hepatitis B and C combined
E) The number of new cases of hepatitis A diagnosed in 1982 and 1998 were exactly the same
Correct Answer:
Verified
Q66: Angiotensin-converting enzyme (ACE) drugs were studied in
Q67: A prospective research looks at the link
Q68: A 65-year-old man arrives to the office
Q69: A 73-year-old man visits the office for
Q70: An epidemiological research is being conducted to
Q72: In patients with severe aortic stenosis, a
Q73: For the previous 15 years, the prevalence
Q74: A new trial on a novel test
Q75: A novel dipstick test for identifying urinary
Q76: A novel tumor marker is being researched
Unlock this Answer For Free Now!
View this answer and more for free by performing one of the following actions

Scan the QR code to install the App and get 2 free unlocks

Unlock quizzes for free by uploading documents