Multiple Choice
Refer to the figure.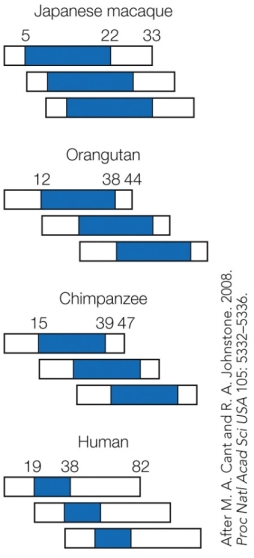 Horizontal bars represent the maximum life spans of three successive generations in each species. The blue shaded areas are the mean reproductive spans. What hypothesis do these results support?
A) The life-history hypothesis.
B) The pay-to-stay hypothesis.
C) The kin selection hypothesis.
D) The grandmother hypothesis.
Correct Answer:
Verified
Related Questions

