Multiple Choice
Refer to the figure.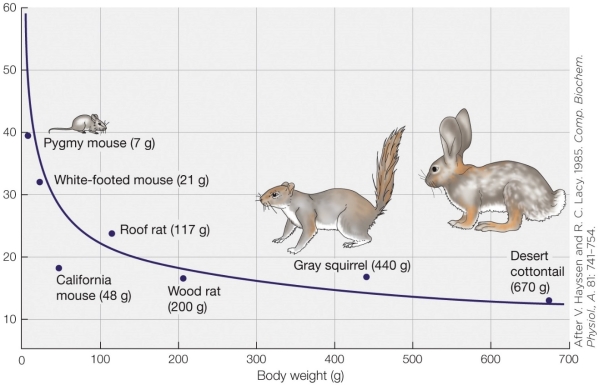 Where on the graph would you plot a wood frog?
A) About half way down directly below the pygmy mouse data point
B) Close to the x axis in the 0- to 100-gram weight range
C) Very close to the wood rat data point
D) About twice as high as the white-footed mouse data point
Correct Answer:
Verified
Related Questions
Q44: Suppose that the body‒surface area of mammals
Q45: Rubner's surface "law" cannot be applied to
Q46: The exponent for the relationship between metabolic
Q47: Attempts to explain the mechanistic basis for

