Multiple Choice
Refer to the figure.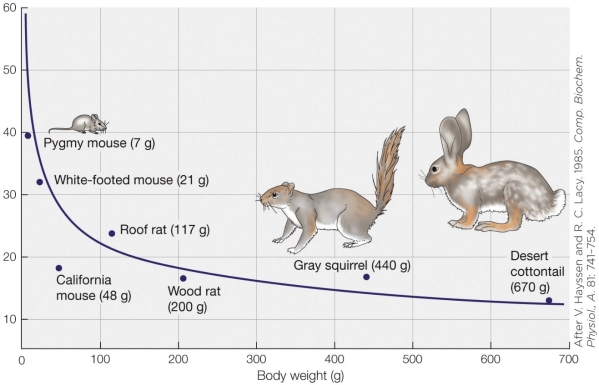 Based on the graph, change the scale of both axes and change the y axis units to be non-mass-specific. What is the best description of the line that fits the replotted data?
A) A straight line that begins low on the y axis and increases moving along the x axis
B) A straight line that begins high on the y axis and decreases moving along the x axis
C) Very similar shape to the plot above with different units on the y axis
D) An exponential curve that begins low on the y axis and increases moving along the x axis
Correct Answer:
Verified
Related Questions
Q46: The exponent for the relationship between metabolic
Q47: Attempts to explain the mechanistic basis for

