Refer to the figure shown.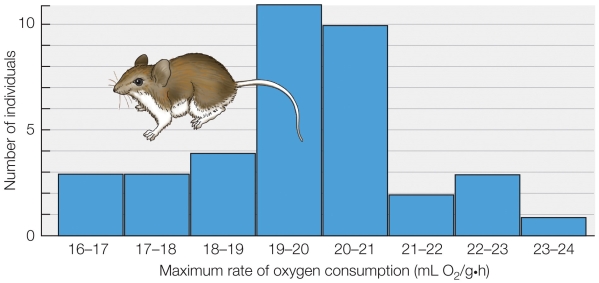 Which technique for the study of adaptation was used to generate the data shown in the figure?
A) Studies of laboratory populations over many generations
B) Single-generation studies of individual variation
C) Creation of variation for study
D) Studies of genetic structures of natural populations
Correct Answer:
Verified
Q48: Which process most likely leads to adaptive
Q49: Which observation best demonstrates the process of
Q50: Which conclusion was not made from the
Q51: The raw material(s) for evolution is(are)
A) trait
Q52: Which method is based on the premise
Q54: Refer to the figure shown. Q55: Refer to the figure shown. Q56: Refer to the figure shown. Q57: Using the firefly as an example, explain Q58: Compare and contrast adaptation and natural selection. Unlock this Answer For Free Now! View this answer and more for free by performing one of the following actions Scan the QR code to install the App and get 2 free unlocks Unlock quizzes for free by uploading documents![]()
![]()
![]()

