Disparities can be further disaggregated in order to identify areas of need that may be under-addressed. Table 13.4 presents data on death rates per 100,000 by age, race/ethnicity, and sex for 2013. Please refer to Table 13.4 for any questions that contain data from this table. These questions assess your competencies in correctly reading, analyzing and evaluating data on life expectancy disparities.
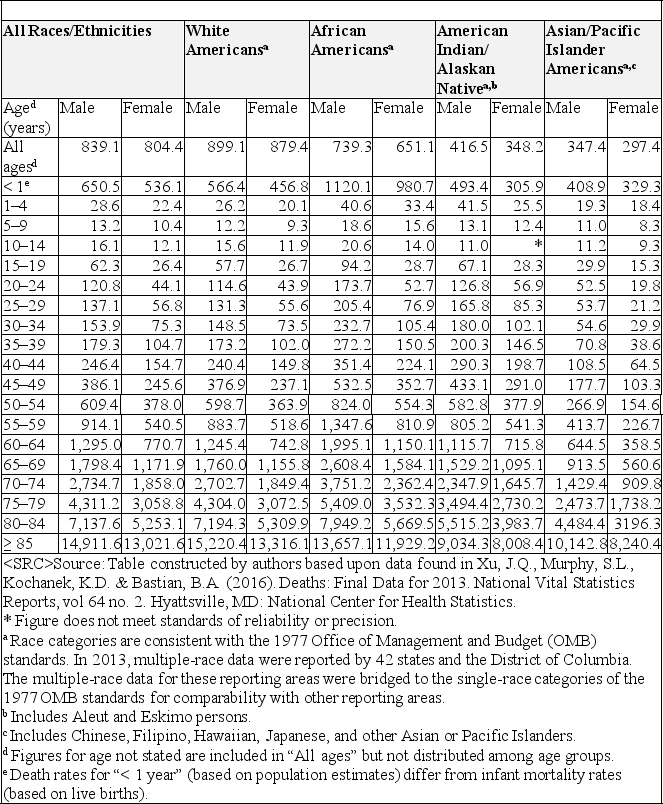
-When the disparities in death rates are disaggregated by race/ethnicity and sex, which statement or statements below are true for the 25-29 age bracket?
A) The death rate for Asians/Pacific Islanders males age 25-29 is 153.3% higher than for their female counterparts
B) The comparable rate for African American males age 25-29 is 167.1% higher than for their female counterparts
C) The comparable rate for American Indian/Alaskan Native males age 25-29 is 94.37% higher than for their female counterparts.
D) The comparable rate for White American males age 25-29 is 136.15% higher than for their female counterparts.
E) All of the above are true
F) a and b are true
G) b and e
H) All of the above are true.
I) None of the above are true
Correct Answer:
Verified
Q17: Disparities can be further disaggregated in order
Q18: Disparities can be further disaggregated in order
Q19: Disparities can be further disaggregated in order
Q20: Disparities can be further disaggregated in order
Q21: Disparities can be further disaggregated in order
Q23: Disparities can be further disaggregated in order
Q24: Disparities can be further disaggregated in order
Q25: Disparities can be further disaggregated in order
Q26: Disparities can be further disaggregated in order
Q27: Disparities can be further disaggregated in order
Unlock this Answer For Free Now!
View this answer and more for free by performing one of the following actions

Scan the QR code to install the App and get 2 free unlocks

Unlock quizzes for free by uploading documents