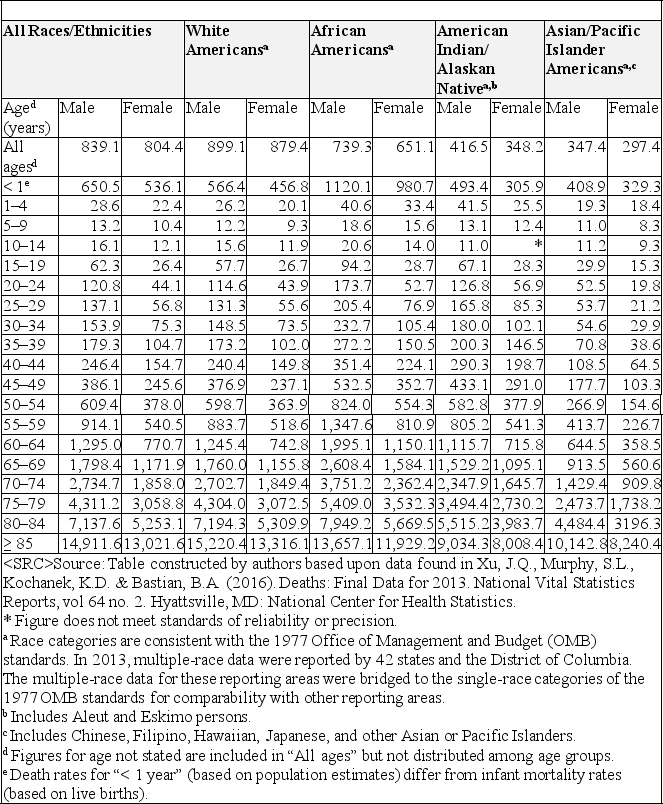
Disparities can be further disaggregated in order to identify areas of need that may be under-addressed. Table 13.4 presents data on death rates per 100,000 by age, race/ethnicity, and sex for 2013. Please refer to Table 13.4 for any questions that contain data from this table. These questions assess your competencies in correctly reading, analyzing and evaluating data on life expectancy disparities.
-What is the approximate life expectancy for all the states in the country.
A) 79.1 years
B) 89.1 years
C) 78.11 years
D) 91.8 years
E) None of the above
Correct Answer:
Verified
Q22: Disparities can be further disaggregated in order
Q23: Disparities can be further disaggregated in order
Q24: Disparities can be further disaggregated in order
Q25: Disparities can be further disaggregated in order
Q26: Disparities can be further disaggregated in order
Q28: Disparities can be further disaggregated in order
Q29: Disparities can be further disaggregated in order
Q30: Disparities can be further disaggregated in order
Q31: Disparities can be further disaggregated in order
Q32: Disparities can be further disaggregated in order
Unlock this Answer For Free Now!
View this answer and more for free by performing one of the following actions

Scan the QR code to install the App and get 2 free unlocks

Unlock quizzes for free by uploading documents