Refer to the figures.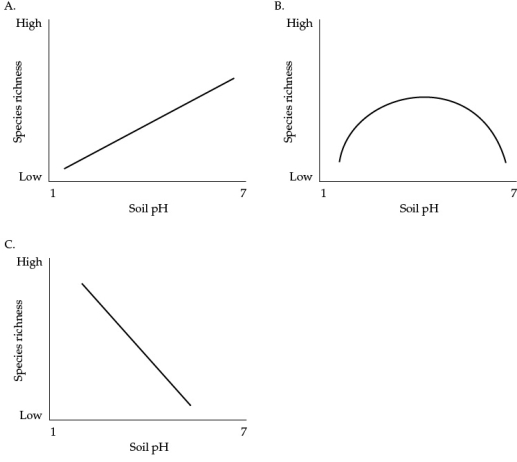 Based on Gough's study and others, which figure shows the most likely relationship between plant species richness and soil acidity?
A) Figure A
B) Figure B
C) Figure C
D) Figure A in wet climates; Figure B in dry climates
Correct Answer:
Verified
Q6: Which statement best describes the relationship between
Q7: Chemical weathering of minerals in rocks is
Q8: The availability of nutrient cations such as
Q9: Silt is soil that
A) has particles larger
Q10: Why is there likely to be a
Q12: Refer to the figure. Q13: Refer to the figure. Q14: Which sequence best describes the order of Q15: Refer to the figure. Q16: The atmosphere is composed of _% nitrogen Unlock this Answer For Free Now! View this answer and more for free by performing one of the following actions Scan the QR code to install the App and get 2 free unlocks Unlock quizzes for free by uploading documents![]()
![]()
![]()

