Refer to the figure.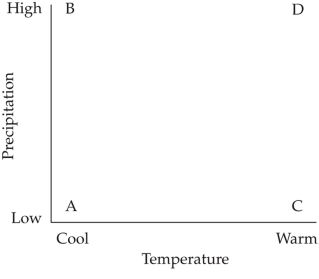 The figure shows the relationship between temperature and precipitation in different climate regimes (points A‒D) . Suppose that the climates in the graph have been maintained for a long period of time. With everything else being equal, in which climate regime would you expect soil quality in terms of mineral-derived nutrients to be the lowest?
A) Regime A
B) Regime B
C) Regime C
D) Regime D
Correct Answer:
Verified
Q8: The availability of nutrient cations such as
Q9: Silt is soil that
A) has particles larger
Q10: Why is there likely to be a
Q11: Refer to the figures. Q12: Refer to the figure. Q14: Which sequence best describes the order of Unlock this Answer For Free Now! View this answer and more for free by performing one of the following actions Scan the QR code to install the App and get 2 free unlocks Unlock quizzes for free by uploading documents![]()
![]()

