Refer to the figures.
Figure 1
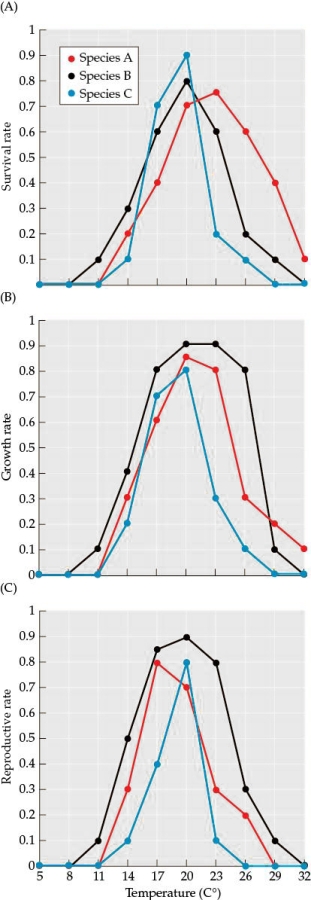 Figure 2
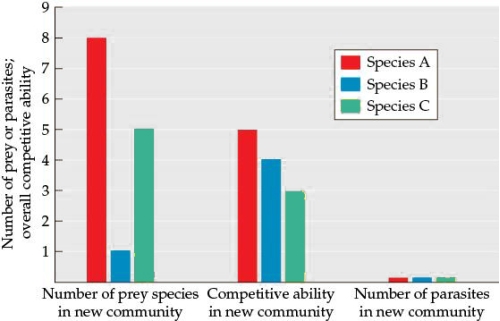 You are evaluating three snail species to determine their overall threat as invasive species to an area. You bring several individuals of each species into your lab to test their tolerance of a range of abiotic and biotic factors. Figure 1 shows how the three snail species respond to differences in average temperature and Figure 2 shows the number of prey and parasite species for each of the species in the new areas, along with how competitive each potential invasive species will be in the new community (higher numbers indicate that the species will be a more successful competitor).
-Assume that the average summer temperature in the new area is 26°C. Based solely on species-level tolerances of abiotic factors (Figure 1), which snail species poses the least threat as an invasive species, and why? How would you classify this species in terms of the range of abiotic conditions it tolerates as compared to the other species?
Correct Answer:
Verified
View Answer
Unlock this answer now
Get Access to more Verified Answers free of charge
Q42: According to the complementarity hypothesis, community function
Q43: Refer to the figures. Q44: Refer to the table. Q45: Which of the following is not one Q46: Species must pass through several "filters" to Q48: Refer to the figures. Q49: Refer to the figures. Q50: Refer to the figures. Q51: Refer to the figures. Q52: Refer to the figure. Unlock this Answer For Free Now! View this answer and more for free by performing one of the following actions Scan the QR code to install the App and get 2 free unlocks Unlock quizzes for free by uploading documents![]()
![]()
Figure 1

Figure 1
Figure 1
Figure 1
![]()

