Refer to the figure.
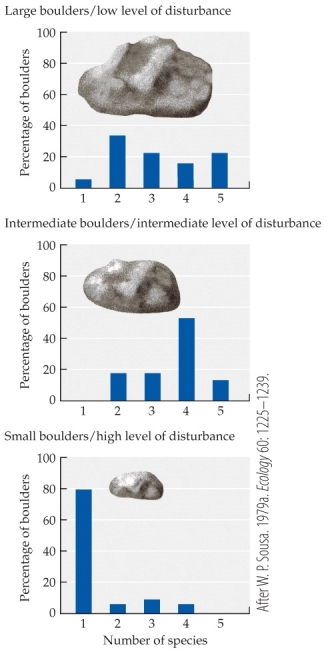 The figure depicts Sousa's test of the intermediate disturbance hypothesis. Why is boulder size associated with the level of disturbance? Do these data support or refute the intermediate disturbance hypothesis? Justify your reasoning using the figure.
Correct Answer:
Verified
View Answer
Unlock this answer now
Get Access to more Verified Answers free of charge
Q47: Refer to the figures.
Figure 1

Q48: Refer to the figures.
Figure 1
Q49: Refer to the figures.
Figure 1
Q50: Refer to the figures.
Figure 1
Q51: Refer to the figures.
Figure 1
Q53: Refer to the figures.
Figure 1
Q54: Refer to the table.
Table 1
Q55: Refer to the figure.
Figure 6
Q56: Refer to the figure.
Figure 8
Q57: Refer to the figure.
Figure 8
Unlock this Answer For Free Now!
View this answer and more for free by performing one of the following actions

Scan the QR code to install the App and get 2 free unlocks

Unlock quizzes for free by uploading documents