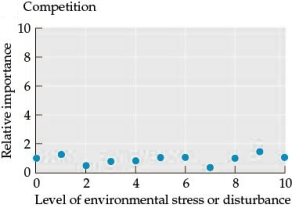
Refer to the figure.
Figure 8
 You are studying a new area to determine how disturbances affect species diversity. You are now investigating the impact of species richness on community function.Answer the following questions:
a) Create two graphs (this will be referred to as Figure 9) showing the predicted relationship between species richness and community function for (A) the complementary hypothesis, and (B) the redundancy hypothesis. Label your x- and y-axes.
b) At which point, if any, could species richness decline without impacting community function? Circle this area on your graphs (this will be referred to as Figure 10).
c) How would the predicted relationship change if species differed in their overall effect on community function? How might the removal of species affect community function in ways not predicted by your graph (Figure 9)?
Correct Answer:
Verified
Figure 9
Figure 10
View Answer
Unlock this answer now
Get Access to more Verified Answers free of charge
Q52: Refer to the figure. Q53: Refer to the figures. Q54: Refer to the table. Q55: Refer to the figure. Q56: Refer to the figure. Q58: Humans impact all of the factors that Q59: The algae Caulerpa taxifolia is native to Q60: The failure of some non-native species to Q61: Which combination of attributes of a community Q62: Refer to the table.
![]()
Figure 1

Table 1
Figure 6
Figure 8
![]()
Unlock this Answer For Free Now!
View this answer and more for free by performing one of the following actions

Scan the QR code to install the App and get 2 free unlocks

Unlock quizzes for free by uploading documents